Seastate
Live California marine conditions on WordPress — real NOAA tide and buoy feeds ingested on a system cron into a custom table, served as server-rendered blocks hydrated by the Interactivity API.
Overview
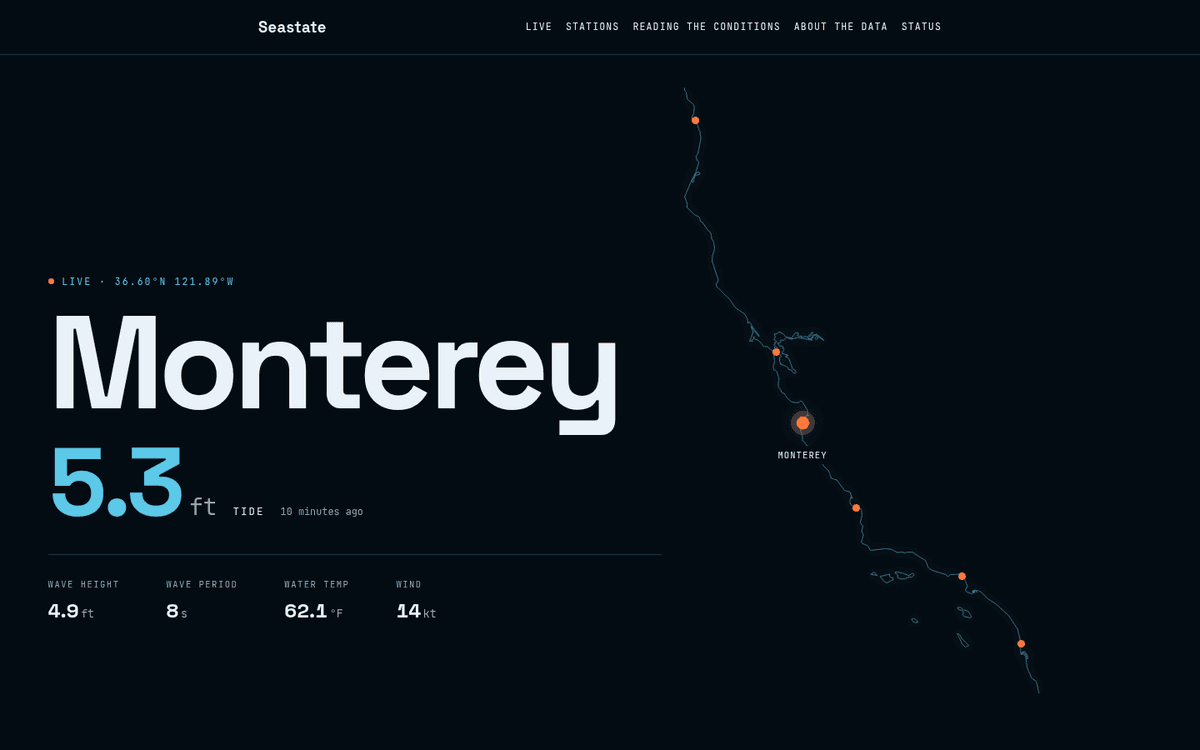
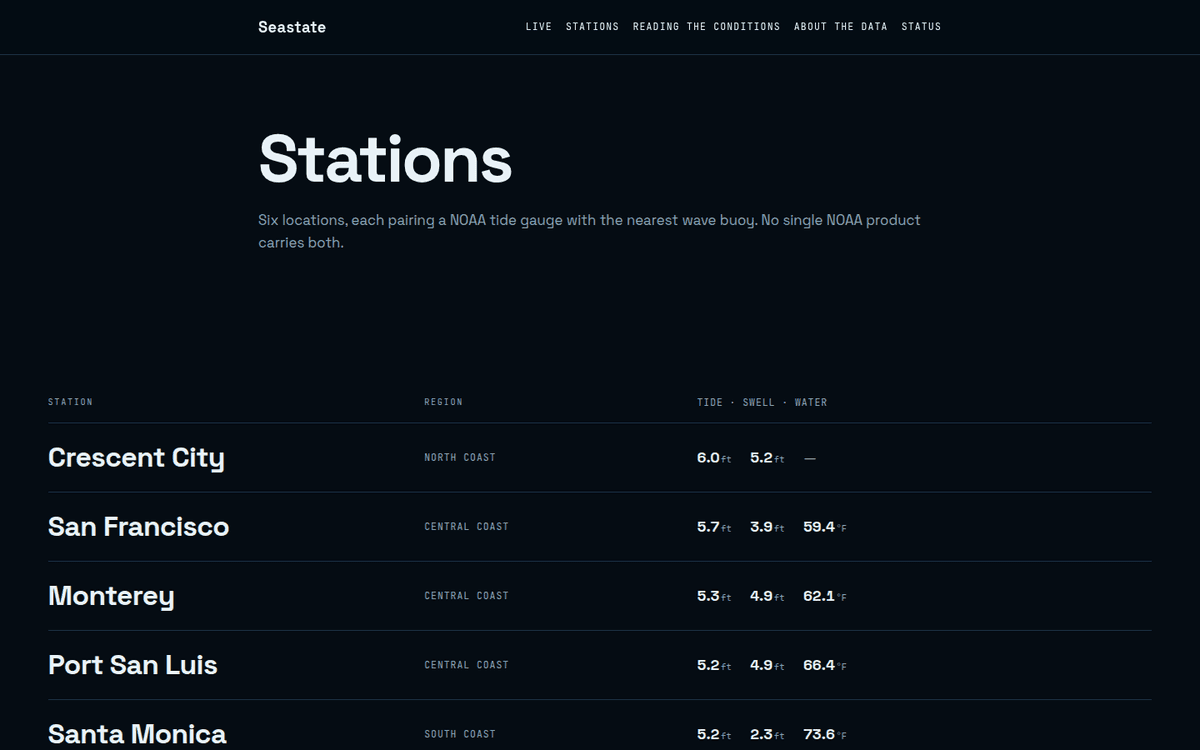
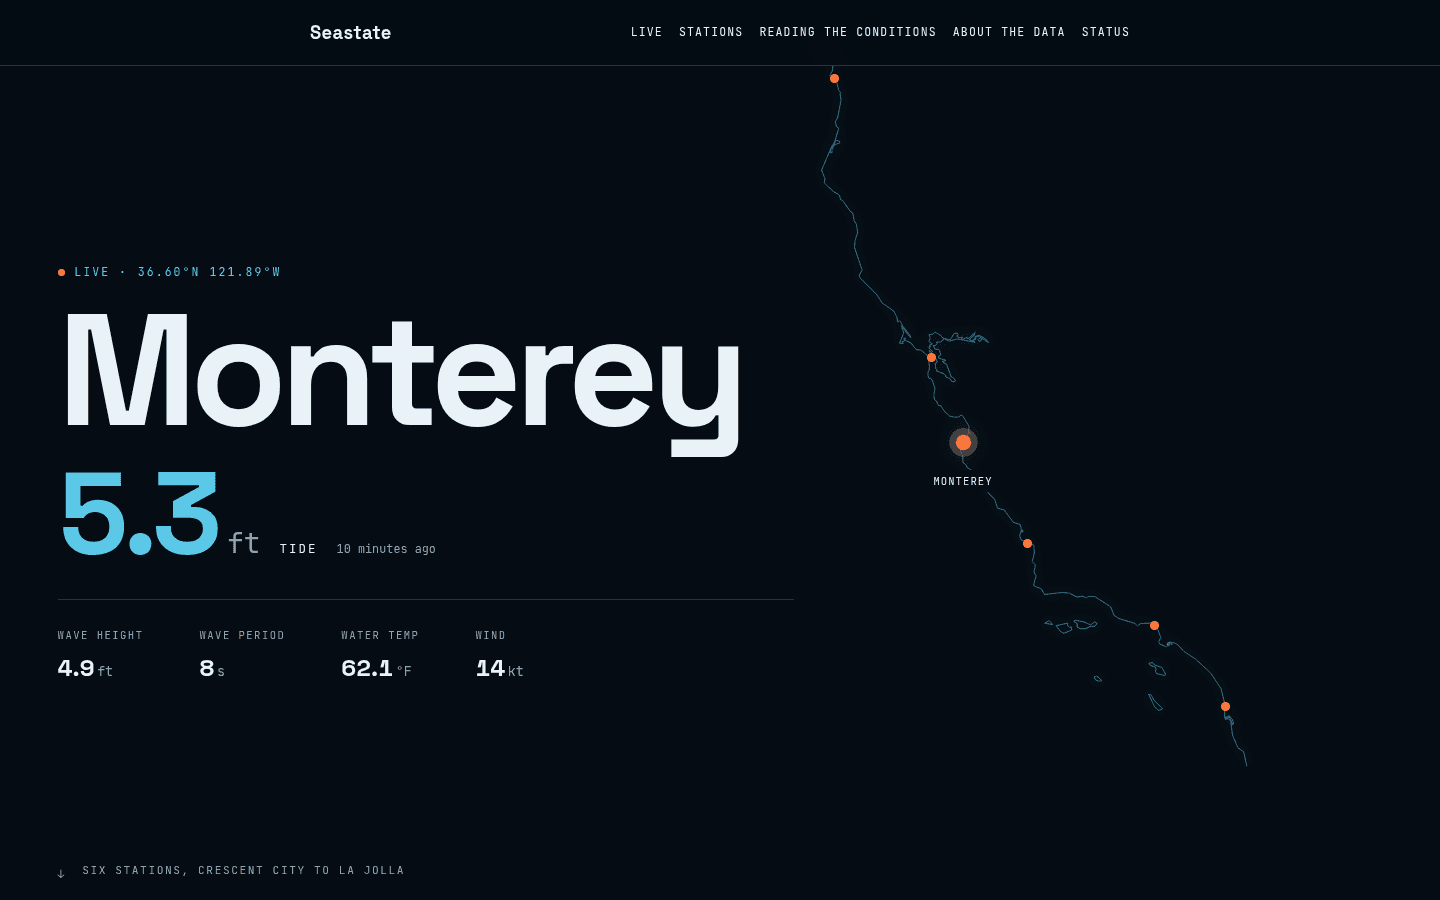
Every other demo on this platform is a marketing site. Competent ones, but nothing on them responds to the visitor. Seastate's homepage is a live data surface that changes while you watch — six NOAA stations from Crescent City to La Jolla, each pairing a CO-OPS tide gauge with the nearest NDBC wave buoy, because no single NOAA product carries both.
The interesting engineering is not the front end. It is what it takes to put someone else's real, messy, government data on a page and have it stay honest.
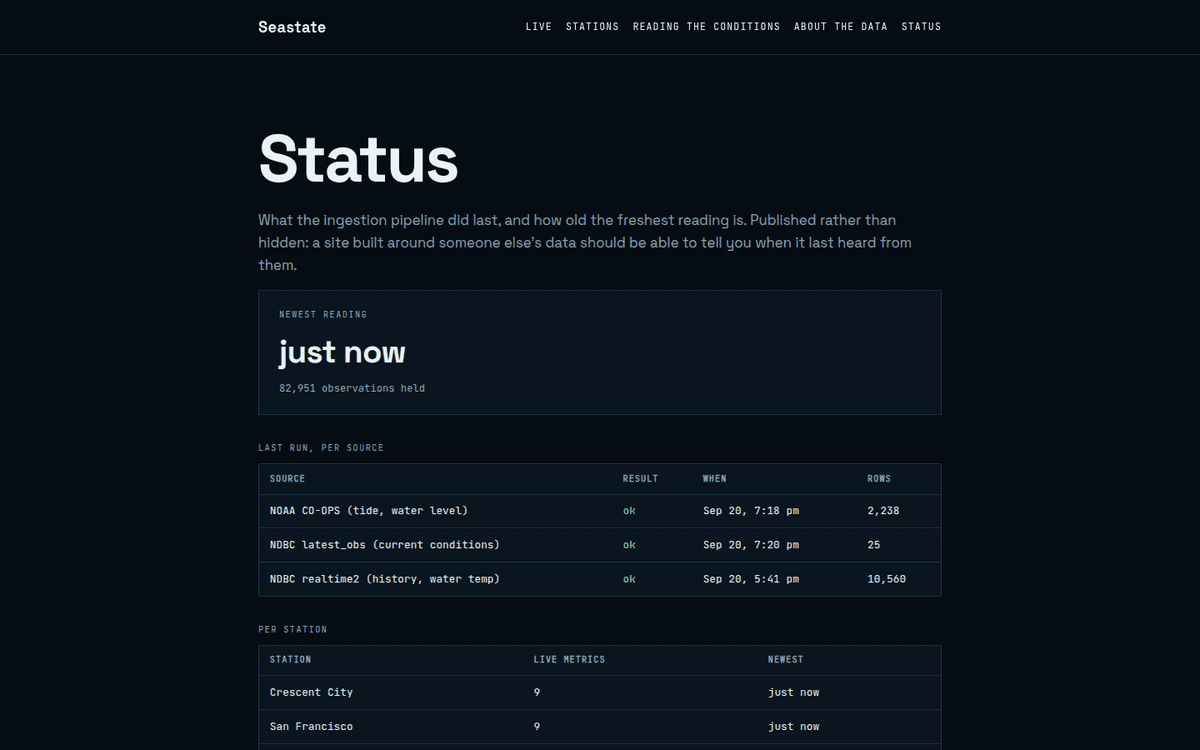
Freshness is per field, not per row.
MM is NDBC's missing-value sentinel, and it is the norm rather than an edge case. Measured live across 1,926 parsed rows:
wave_height— 33.8% missingwave_period— 45.0% missingair_temp— 50.0% missingwater_temp— 17.5% missing
So "the latest row" is the wrong question to ask. Every figure asks for the most recent non-null value for its own station and its own metric, and carries its own timestamp — which is why two figures on the same card can legitimately disagree about what time it is. Showing them as equally fresh would be the lie.
Storage is UTC and metric, always.
NDBC publishes UTC; CO-OPS answers in whatever zone you ask it for, so the fetcher asks for gmt explicitly. Mixing the two yields rows that look fine individually and are silently seven or eight hours apart — with the error moving twice a year at daylight saving. Units are the same story: display units are a front-end concern and never a storage one.
Two NDBC parsers, because one endpoint would cost 874 MB a day.
| Purpose | Endpoint | Size | Cadence |
| --- | --- | --- | --- |
| Steady-state conditions | latest_obs | 192 B | 10 min |
| Water temp, history, backfill | realtime2 | 607 KB | 6 h, conditional GET |
Polling realtime2 every six minutes across six stations pulls roughly 874 MB a day from a government server to collect a few hundred values. Conditional GET alone only removes the redundant ~40% — the file genuinely changes every ten minutes, and every changed fetch is still 607 KB. Splitting the endpoints takes it under 20 MB a day.
The cost is a second parser, because latest_obs is a different artifact: imperial units, latin-1, human-formatted, and it omits water temperature — which is why realtime2 has not gone away.
That unit conversion is the risk, so it is checked rather than trusted.
A probe compares a latest_obs reading against a realtime2 reading for the same station and metric. A skipped ft→m conversion leaves wave height 3.28x too large; a doubled one leaves it 3.28x too small. Either shows up immediately. Verified by deliberately breaking the conversion constant and confirming the check caught it on both stations with overlapping wave data.
The probe runs the real parsers against the real endpoints with no WordPress involved, so the risky half of the pipeline is provable before an install exists. It is a probe and not a unit test — it may fail because NOAA is having a bad morning, and it says so rather than blaming the parser.
The Challenge
WordPress gets dismissed as a brochure CMS the moment a project involves live third-party data, on the assumption that anything dynamic belongs in a JavaScript app with its own backend. The dismissal is rarely tested against what the work actually is: scheduled ingestion, a schema that survives a flaky upstream, and a page that tells the truth about how fresh each number is.
The Solution
A system cron ingests NOAA CO-OPS and NDBC feeds into a custom table; server-rendered blocks read it and hydrate with the Interactivity API. Freshness is tracked per field rather than per row, storage is UTC and metric by rule, and the unit conversion between the two NDBC endpoints is verified against live data rather than assumed.
Results
Six live stations from Crescent City to La Jolla, each pairing a CO-OPS tide gauge with the nearest NDBC wave buoy
Per-field freshness — every figure carries its own timestamp, because 17–50% of any given NDBC field is missing at any moment
Ingest traffic cut from ~874 MB/day to under 20 MB/day by splitting
latest_obsfromrealtime2rather than polling the large endpointThe ft→m conversion is proven against live data by cross-endpoint comparison, not asserted — and the check was itself verified by deliberately breaking the constant
UTC and metric enforced at the storage boundary, so a daylight-saving shift cannot silently skew rows by seven hours
The risky half of the pipeline is testable with no WordPress install present
Gallery